
Improvement: Feed Back Measurement Data
You can execute the measurement feedback per CMYK object (CMYK Image, CMYK Graphic and CMYK Text).
It is executed on the [Measurement Feedback] screen.
To use a colorimeter, install its device driver on your computer.
Patterns of charts and available sizes of paper vary among types of colorimeters.
According to the colorimeter, operations differ. Refer to its manual.
Click [Adjust] of the CMYK object to execute the measurement feedback.
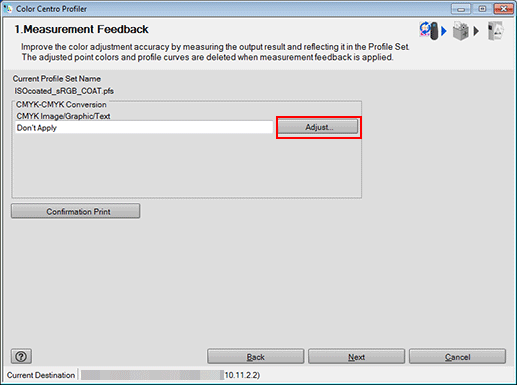
[Feedback] screen is displayed.
Click [Measure].
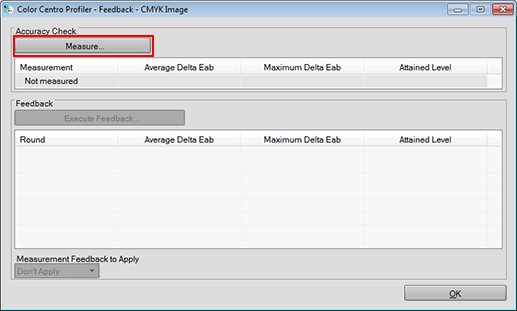
[Measurement] screen appears.
Select a colorimeter from [Instrument].
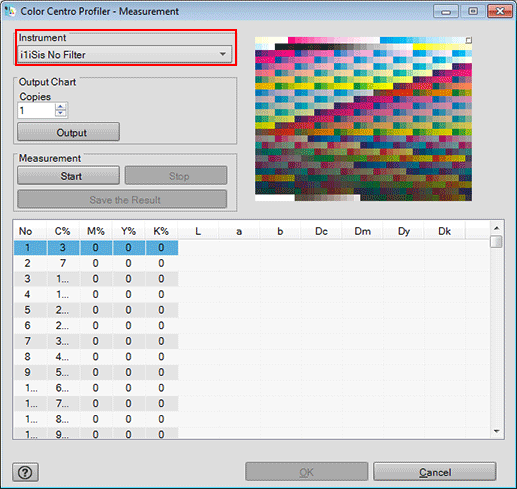
According to the selection, the chart image appears on the upper-right of the screen.
[i1iSis (UV Filer)] returns the measurement result with the UV cut filter.
Specify the copy number of the chart outputting to [Copies].
Click [Output] to print the chart.
Click [Start] to start the measurement.
An operation screen for the colorimeter appears. Follow the instructions on the windows that follow.
The current position of measurement appears on the chart image of the upper-right of the screen.
If you measure a wrong line, a warning message appears. You can select either to try again with the correct line or to proceed to the next line.
To stop the measurement, click [Stop].
After the acquirement of measurement data, [Save the Result] becomes available.
The value of each patch appears in the measurement result list.
Click [Save the Result] after completing the measurement.
[Save As] screen appears.
Specify the saving place and file name, and click [Save].
[Measurement] screen returns after saving the measurement result file.
Click [OK].
[Feedback] screen returns.
On [Feedback] screen, the measurement data is displayed.
Click [Execute Feedback].
Profile is calculated.
After completing calculation, [Measurement] screen appears.
Repeat from Step 4 to Step 9.
On [Feedback] screen, the new measurement data is added.
The attained level which indicates the improvement of the accuracy is displayed on [Attained Level].
The attained level is indicated in 3 levels. The maximum level of the attained level is indicated as "
 ".
".
Confirm [Attained Level] and repeat the operation from Step 10 to Step 11 up to the target level.
On [Feedback] screen, the new measurement data is added.
You can repeat these operations 8 times at the maximum.
When you reach the maximum level and click [Execute Feedback], the warning screen is displayed. When you execute the feedback, click [OK]. When you finish the feedback, click [Cancel].
Confirm [Attained Level] is reached to the target level, and select the number of the feedback (n times) which acquires the value to adopt for profile from [Measurement Feedback to Apply].
Click [OK].
[Feedback] screen is closed to return to the [Measurement Feedback] screen.
Repeat from Step 1 to Step 14 for other CMYK objects.
The [Measurement Feedback] screen returns.
Click [Confirmation Print] for the test printing.
[Output Chart] screen is displayed.
Set the Output Chart settings and click [Print].
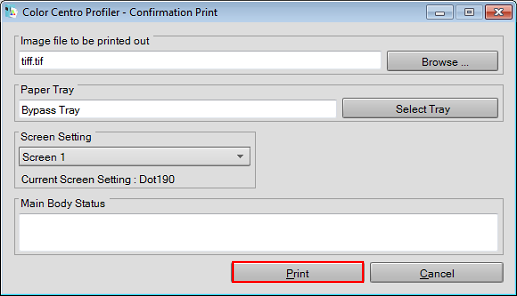
On the screen displayed by clicking [Select Tray], select the tray to be used for chart output.
From [Screen Setting], select the screen setting to be used for chart output.
When you select [Cancel], the [Output Chart] screen closes and the screen returns to the [Measurement Feedback] screen.
Confirm the result of test printing and click [Next].
The Complete Profile Set screen appears.