
Color Density Control (Adjustment Flow When Changing the Screen / Regular Adjustment Flow (Standard) / Regular Adjustment Flow (High Accuracy))
You can execute the color density control only when the RU option (Relay Unit RU-509) is available.
You can use the density sensor equipped with the RU option (Relay Unit RU-509) to measure the patch density of the chart for γ correction and perform calibration.
Instead of the γ correction by the internal IDC sensor, the density is corrected by using the printed chart image. This enables secondary transfer, fusing, and correction with each paper's characteristics taken into consideration.

With the RU option, manual calibration is unnecessary. Note that in that case, on the touch panel of the main body, press [Adjustment] - [Quality Adjustment] - [Color Density Control] - [Basic Setting], and then set [Periodical Adj. Execution] to [ON]. [Color Density Control] is not selectable unless [Use Color Density Control] is set to [ON].
The color density control consists of the following three adjustments:
Details of color density control | Description |
|---|---|
Basic Setting | You can enables the color density control and set the execution timing, etc.
|
Each Paper Type Color Sensor Adjustment | You can measure and register the density adjustment data corresponding to each paper type.
|
Color Density Manual Control | You can manually adjust the color density. |
• Image quality adjustment flow and the position of this adjustment
In the pre-output image quality adjustment flow, this adjustment is positioned shown below.
Perform the previous adjustment before proceeding with this adjustment.
When Intelligent Quality Optimizer IQ-501 is mounted on the machine, this adjustment is positioned in the same way as the above.

To not continuously perform the series of adjustment of the image quality adjustment flow, perform Gamma Automatic Adjustment (Adjustment Flow When Changing the Screen / Regular Adjustment Flow (High Accuracy)), and then resume from the next adjustment.
- For Image Controller IC-603:
Image quality adjustment flow | Position of this adjustment | |||
Previous adjustment | This adjustment | Next adjustment | ||
Adjustment flow when changing the screen | Without RU | - (None) | ||
With RU | (STEP 3: Density balance adjustment) | STEP 4: This adjustment *: Optional | (STEP 5: Advanced calibration) | |
Regular adjustment flow (Standard) | Without RU | - (None) | ||
With RU | This adjustment (Basic Setting)
| |||
Regular adjustment flow (High accuracy) | Without RU | - (None) | ||
With RU | (STEP 3: Maximum density adjustment) | STEP 4: This adjustment (Basic Setting, Each Paper Type Color Adjustment (*), Color Density Manual Control) *: Optional | - (None) | |
- For Image Controller IC-417 or Image Controller IC-313:
Image quality adjustment flow | Position of this adjustment | |||
Previous adjustment | This adjustment | Next adjustment | ||
Adjustment flow when changing the screen | Without RU | - (None) | ||
With RU | (STEP 3: Density balance adjustment) | STEP 4: This adjustment *: Optional | (STEP 5: Calibration) | |
Regular adjustment flow (Standard) | Without RU | - (None) | ||
With RU | This adjustment (Basic Setting)
| |||
Regular adjustment flow (High accuracy) | Without RU | - (None) | ||
With RU | (STEP 3: Maximum density adjustment) | STEP 4: This adjustment (Basic Setting, Each Paper Type Color Adjustment (*), Color Density Manual Control) *: Optional | - (None) | |
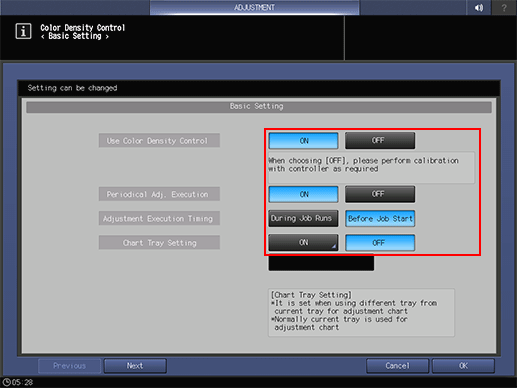
Basic Setting
You can enables the color density control and set the execution timing, etc.
To use Color Density Control, select [ON] in [Use Color Density Control].
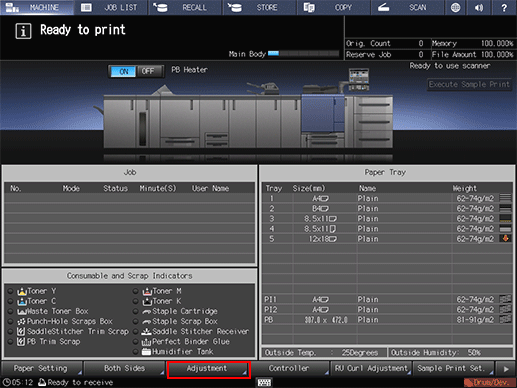
On the touch panel of the main body, press [Adjustment] on the [MACHINE] screen.
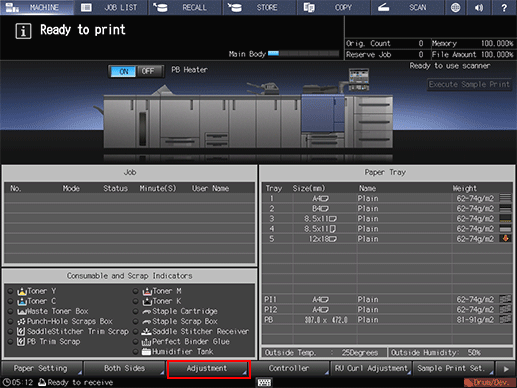
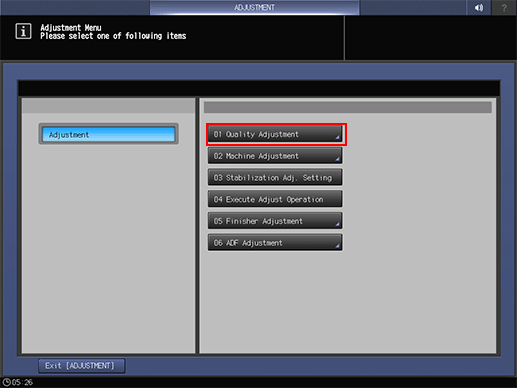
The [Adjustment Menu] is displayed.
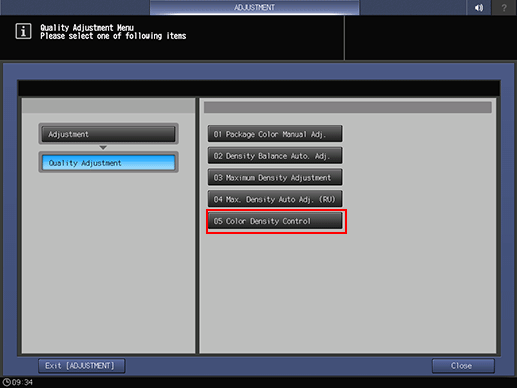
Press [Quality Adjustment] on the [Adjustment Menu].
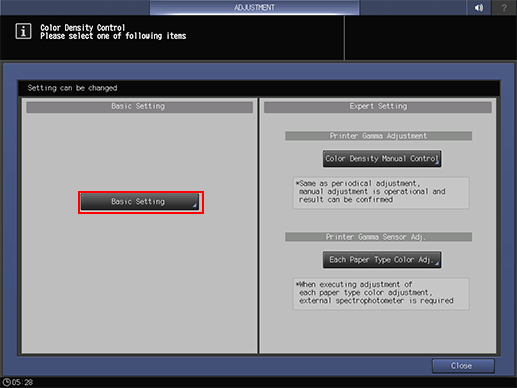
Press [Color Density Control].
Press [Basic Setting].
Make a setting for each item.
Make settings according to your environment. The settings in this case are as follows:
Item
Description
[Use Color Density Control]
[ON]
[Periodical Adj. Execution]
[ON]
[Adjustment Execution Timing]
[Before Job Start]
[Chart Tray Setting]
[OFF]
[Switch Color(1st or 2nd)]
[Precise]
[Adjustment Interval]
[OFF]
To automatically perform the density control with the RU option (Relay Unit RU-509), set the [Periodical Adj. Execution] to [ON].
Each Paper Type Color Sensor Adjustment
You can measure and register the density adjustment data corresponding to each paper type.
* Perform optionally this adjustment as needed.
* When Intelligent Quality Optimizer IQ-501 is mounted on the machine, adjustment is made automatically. When Intelligent Quality Optimizer IQ-501 is not mounted on this machine, chart color measurement is required in the external spectrophotometer (i1-Pro, i1-Pro2 and i1-iSisXL, or FD-5 BT and FD-9).
Also, the dedicated application is required to measure test charts. The application varies depending on your spectrophotometer. For i1-Pro/i1-Pro2 and i1-iSisXL, use X-rite Measure Tool. For FD-5 BT and FD-9, use FD-S2w. Install the tool in advance.
You can download X-rite Measure Tool free of charge at the following Web site. After installing the tool, restart the computer.
ProfileMaker 5 v5.0.10
https://xritephoto.com/ph_product_overview.aspx?ID=757&Action=Support&SoftwareID=931
To use the spectrophotometer, i1iSis, perform Step 14 (select [Measure] from the menu) followed by the procedure of "• For the spectrophotometer, i1iSis."
Measuring the chart using a spectrophotometer
On the touch panel of the main body, press [Adjustment] on the [MACHINE] screen.
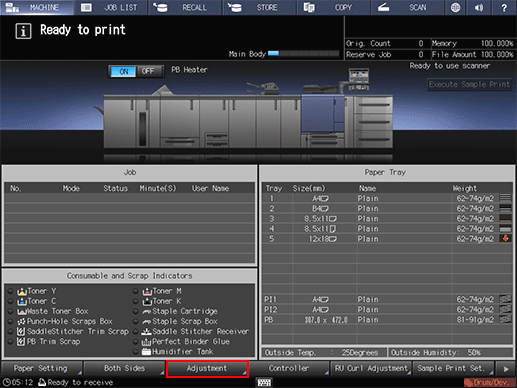
The [Adjustment Menu] is displayed.
Press [Quality Adjustment] on the [Adjustment Menu].
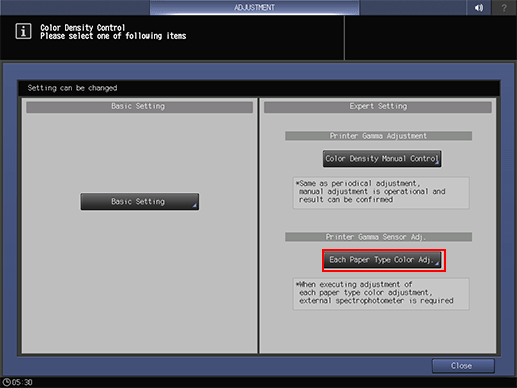
Press [Color Density Control].
Press the [Each Paper Type Color Adj.] of [Expert Setting].

Select the number where the output density control value is to be registered and press [Print Mode].
If you select the registered number, the adjusted value is overwritten.
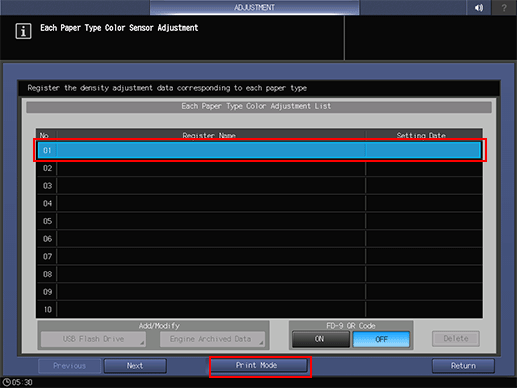
FD9 QR code
i1-iSis XL: Not provided.
FD9: Provided.
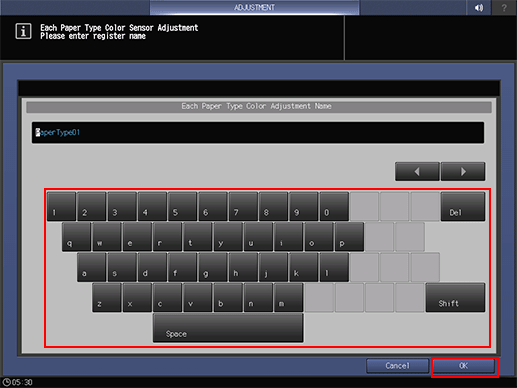
Enter the registered name of the color control for each paper type, and press [OK].
On the [PRINT MODE] screen, press [Quality Adj.].
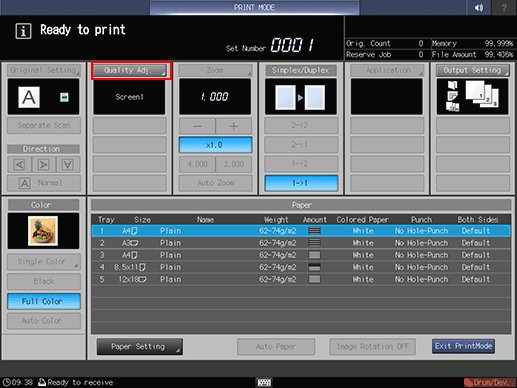
Press [ of ]Screen Pattern
 . After the selection, press [Close].
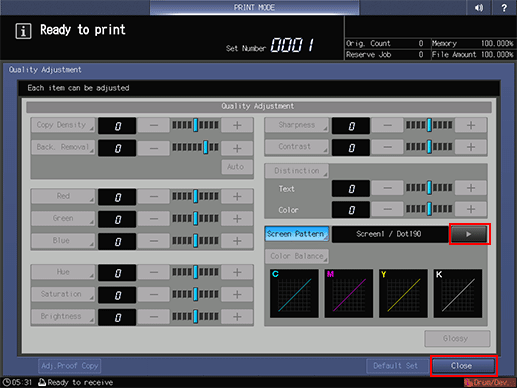
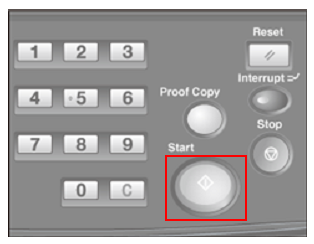
After selecting the tray on the PRINT MODE screen, press Start on the control panel.
To set the output tray, press [Output Setting] at the upper right of the PRINT MODE screen.
The color chart is output for measurement using the spectrophotometer.
To use FD-5 BT or FD-9, use FD-S2w. For details on operations, refer to the user's guide supplied with FD-S2w.
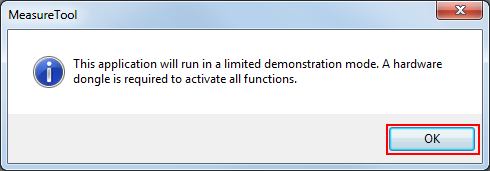
Start the computer where the X-rite Measure tool has been installed, select [Start] - [All Programs] - [X-Rite] - [ProfileMaker Pro 5.0.10] - [MeasureTool].
X-rite Measure tool starts.
To change the language, select a language in [Language] and then restart Measure Tool.
When the following message is displayed, click [OK].
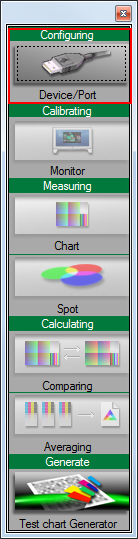
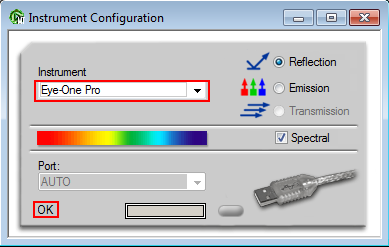
Connect the instrument to the computer. From the menu, click [Configuring].
The [Instrument Configuration] screen is displayed.
In [Instrument], select the spectrophotometer to use. When [OK] is displayed, close the screen.
Example: This example selects [Eye-One Pro] (i1Pro).
From the menu, click [Measuring].
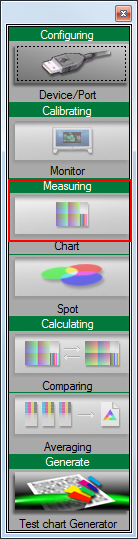
The subsequent operations are described for the case where the spectrophotometer i1Pro is used. For measurement using the spectrophotometer i1iSis, refer to "• For the spectrophotometer i1iSis."
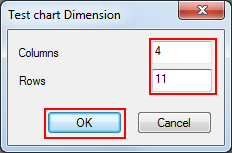
From [Test Chart], select [Custom].
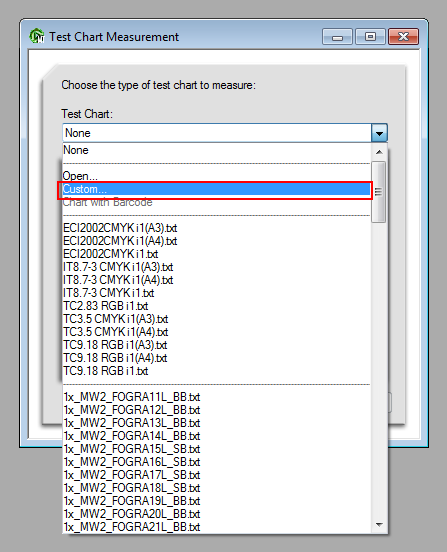
Specify the [Columns] and [Rows], and click [OK].
Specify them according to the size of the chart.
For the spectrophotometer i1Pro / Large size (3 sheets of checking charts): [Columns] = 4, [Rows] = 11
For the spectrophotometer i1Pro / Middle size (4 sheets of checking charts): [Columns] = 4, [Rows] = 8
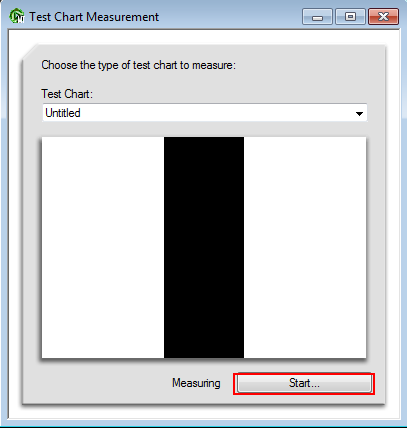
Click [Start].
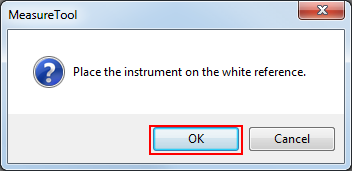
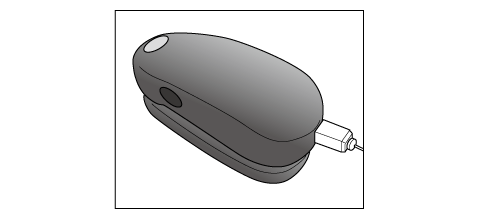
When the following message is displayed, horizontally place the spectrophotometer on the calibration dock and click [OK].
Stack 10 sheets of blank paper whose type is the same as that of the paper where chart has been printed, and place the printed chart on top of it.
To eliminate the influence of the color of the table, place 10 sheets of paper of the same type as the chart underneath the chart to be measured.
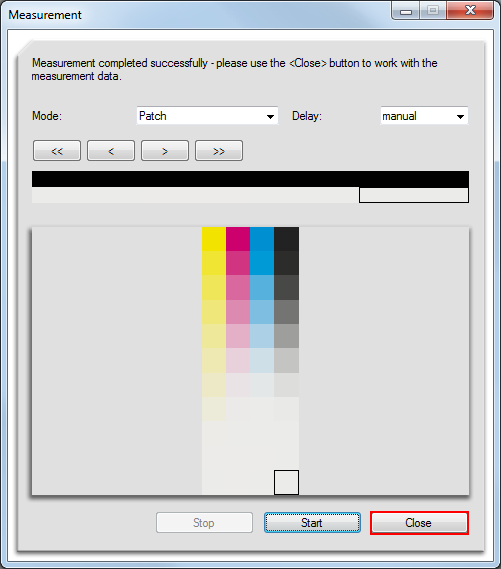
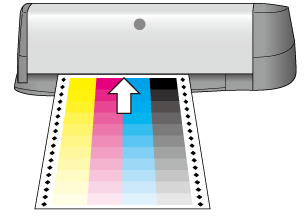
When the following screen is displayed, place the spectrophotometer on the patch at the top in the upper left, and press the button for the spectrophotometer. When beep sounds, check that the read patch is displayed on the screen.

Continuously, place the spectrophotometer on the next right patch, and press the button for the spectrophotometer. Measure all the patches in the same operation.
Measure the rest of the patch rows by sliding the instrument the same way.
If you place the spectrophotometer on the wrong place (patch), click the
 button to go back to the previous patch position.

When you are finished with the chart measurement, click [Close].
Each time the chart measurement is finished, the message is displayed to prompt you to feed the next chart. Save the measurements for each sheet.
Continuously, go to "Saving the measured data," and save the measurement data.
• For the spectrophotometer i1iSis
To use the spectrophotometer, i1iSis, perform Step 14 (from the menu, select [Measure]) followed by the procedure below.
From [Test Chart], select [Open].
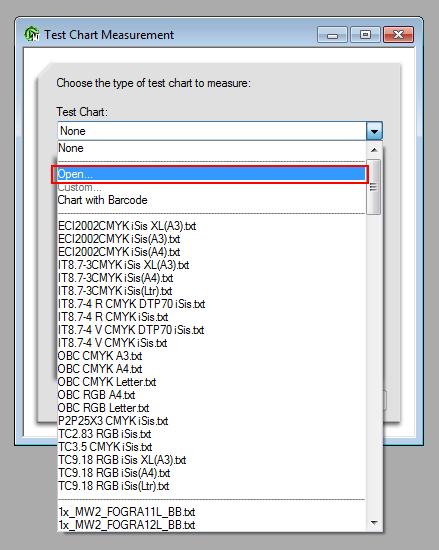
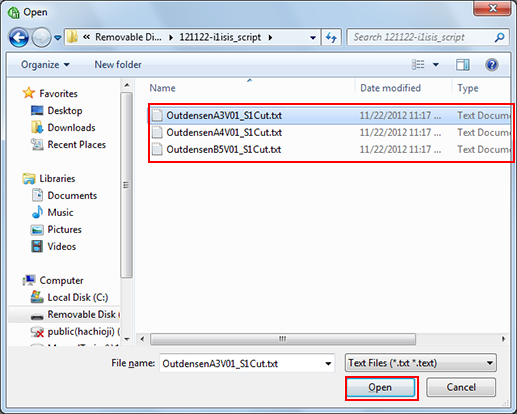
Select the script data for measurement according to the paper size, and click [Open].
There are some script data items particular for each chart size or type. For details, contact your service representative.
On the following screen, click [Start].
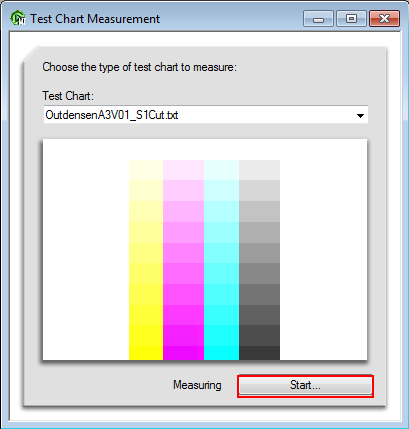
When the following message is displayed, insert the chart into i1iSis.
Cut off the left side of the chart using scissors or such other tools so that the length between the left end of the chart and the black diamond symbol (◆) becomes about 10 mm.
Align the left end of the paper to the left end of the insert opening of i1iSis, and automatically feed the paper one by one. When correctly inserted, the chart is pulled in a few centimeters and comes back a little, and then after a little while, reading starts.
Let the machine automatically feed the paper one by one from the black diamond symbol.

Measurement automatically starts.
Saving the measured data
You can save the data of the output density measured with the spectrophotometer to a USB device such as a USB memory stick or to the computer on the network used by the machine.
From the [File] menu, select [Save As].
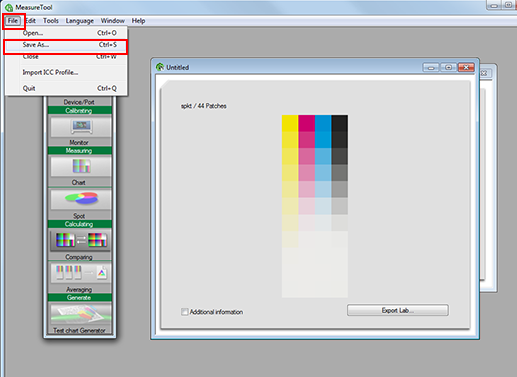
If you use [Export Lab], an error occurs when registering the color adjustment data. When saving the data, always use [Save As].
Specify the destination to save.
Specify USB memory or the computer connected to the machine via the network.
Stored
Description
USB Memory
Connect the USB memory to the computer.
-For ineo+ 2070:
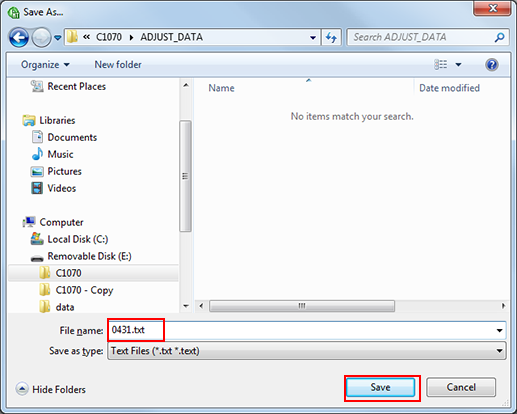
Create a folder, "\C2070\ADJUST _DATA," in the root (immediately below) of the USB memory, and specify the place as the destination to save.
Computer on the network
Open the computer connected to the network used by the machine, and specify a desired folder.
Enter the file name to save the measured data and click [Save].
Specify the "4-character identification number printed on the chart."
Example: 0431.txt, 0432.txt, 0433.txt
The measured data of the color density control is saved.
Repeat the same process to save all the measured data.
Registering the adjusted value in the machine
You can register the measured data (color density value for each paper type) saved in the USB memory or the computer on the network into the machine.
Place to save measured data | Operation |
|---|---|
Measured data saved in the USB memory | Connect the USB memory device and register the data using the control panel of the main body. Refer to "• Registering the measured data saved in the USB memory." |
Measured data saved in the computer on the network | Send (upload) the measured data using Web Utilities from the Web browser and then register the data. For details about Web Utilities, refer to Overview of Web Utilities. Refer to "• Registering the measured data saved in the computer on the network." |
• Registering the measured data saved in the USB memory
On the touch panel of the main body, press [Adjustment] on the [MACHINE] screen.
The [Adjustment Menu] is displayed.
Press [Quality Adjustment] on the [Adjustment Menu].
Press [Color Density Control].
Press the [Each Paper Type Color Adj.] of [Expert Setting].
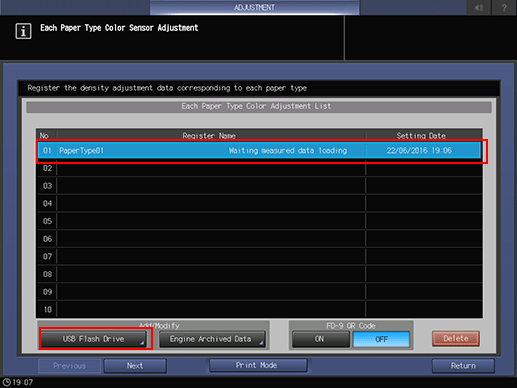
Select the number that was registered when outputting the chart, and press [USB Memory].
For the registered number, [Waiting measured data loading] is displayed.
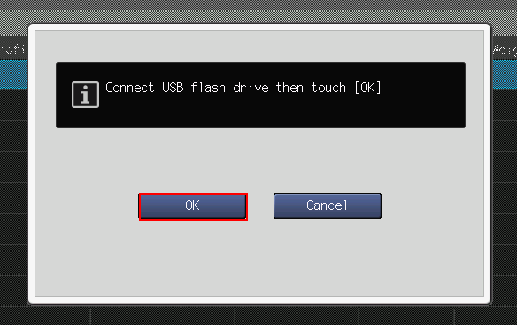
The following screen is displayed. Connect the USB memory where the measured data has been saved to the main body, and press [OK].
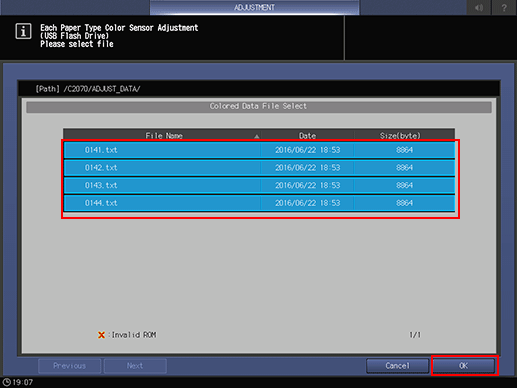
Select the file name of the measured data to be registered and press [OK].
Multiple files corresponding the checking chart are selected at a time. (You cannot select the files individually.)
The adjusted value of the output density is registered in the machine.
• Registering the measured data saved in the computer on the network
On the computer on the network where the measured data has been saved, open a Web browser.
It is recommended that you log in to Web Utilities from the computer where the measured data has been saved.
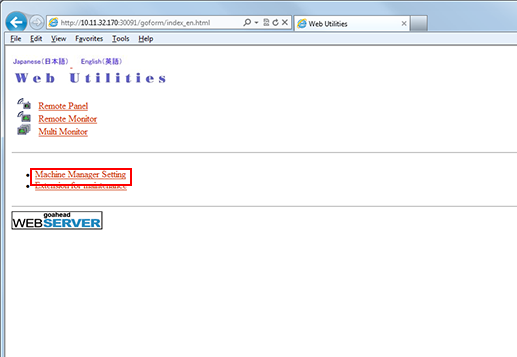
In the URL field, enter "http://IP address of the machine (or the host name):30091" and press the Enter key.
If the controller of EFI is implemented, ":30091" at the end of the IP address is unnecessary.
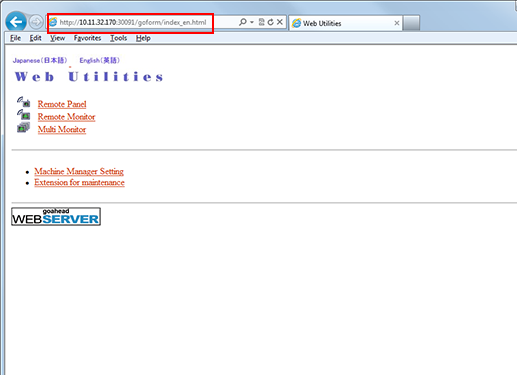
The main page of the Web Utilities is displayed.
Click on [Machine Manager Setting].
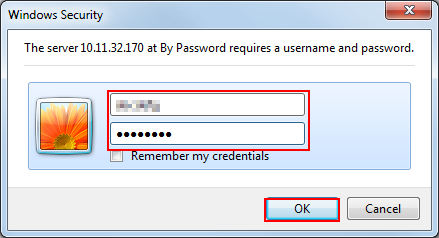
Enter the [User Name] and [Password] and click [OK].
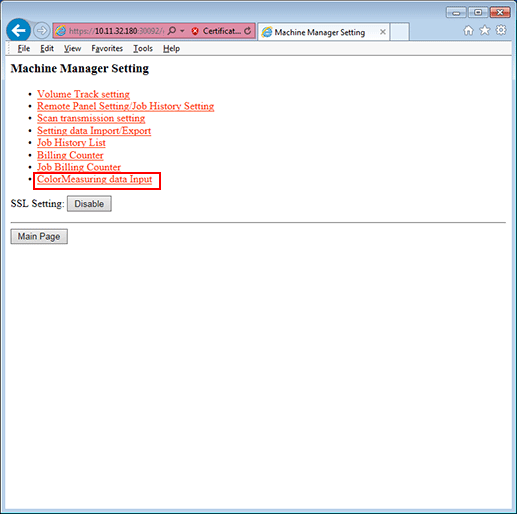
Click on [Color Measuring data Input].
Specify the [File Name] and [File Path] and click [Upload].
File name (Example: 0131.txt)
Click [Reference] of the [File Path] and select the measured data saved in the computer.
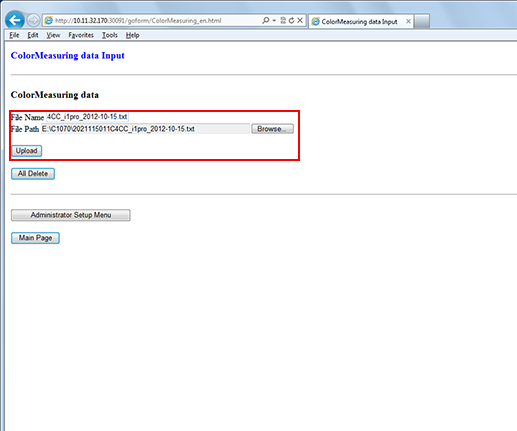
Repeat the same process to upload all the measured data.
On the touch panel of the machine, press [Adjustment] on the [MACHINE] screen, and then press [Color Density Control] in [Quality Adjustment] on the [Adjustment Menu] screen.
Refer to step 1 to step 3 of "• Registering the measured data saved in the USB memory."
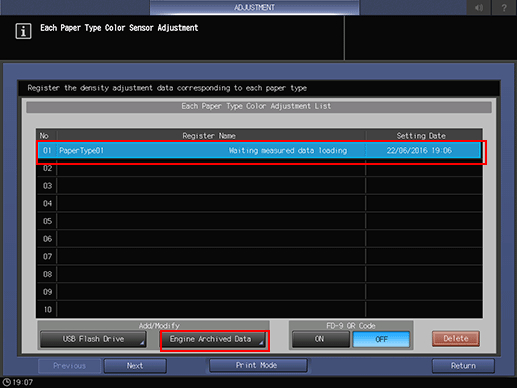
Press the [Each Paper Type Color Adj.] of [Expert Setting].
Select the number that was registered when outputting the chart, and press [Engine Archived Data].
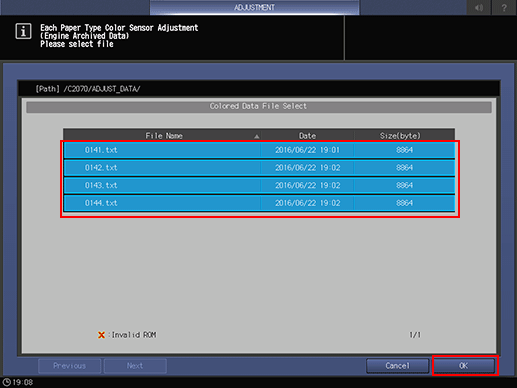
Select the file name of the measured data to be registered and press [OK].
Multiple files corresponding the checking chart are selected at a time. (You cannot select the files individually.)
The adjusted value of the output density is registered in the machine.
Applying the registered adjusted color density to the machine
You can apply the registered adjusted color density to the machine.
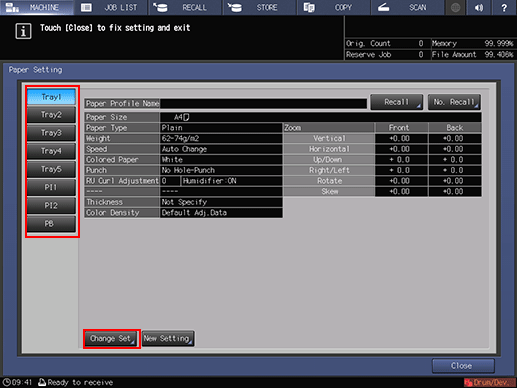
On the touch panel of the main body, press [Paper Setting].
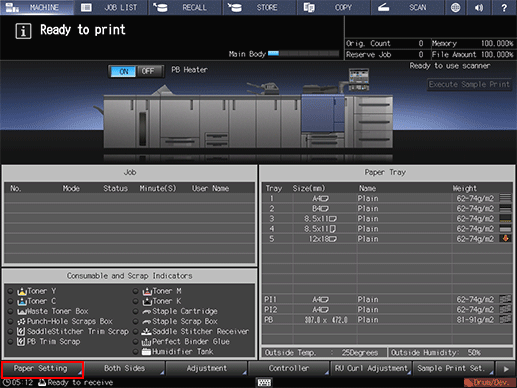
The Paper Setting screen will be displayed.
Select the tray to which the adjusted color density is applied, and press [Change Set].
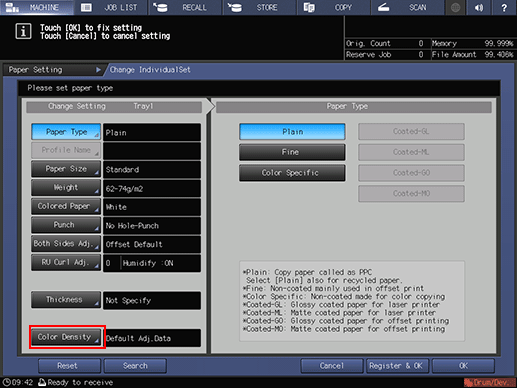
Press [Color Density].
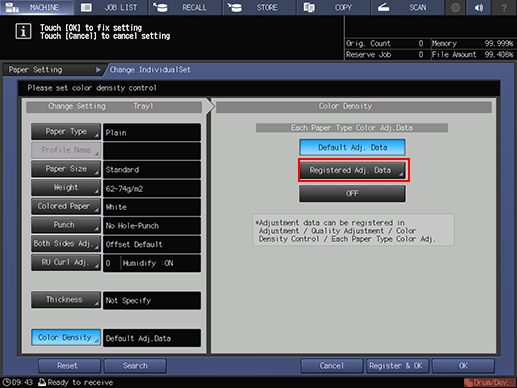
Press [Registered Adj. Data].
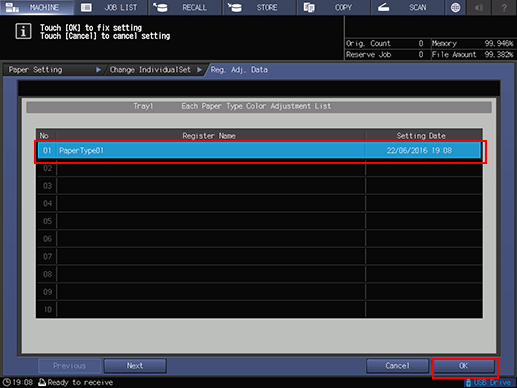
Select the adjusted value to be applied from the list and press [OK].
To use FD-5 BT or FD-9, use FD-S2w. For details on operations, refer to the user's guide supplied with FD-S2w.
Color Density Manual Control
You can manually adjust the color density.
On the touch panel of the main body, press [Adjustment] on the [MACHINE] screen.

The [Adjustment Menu] is displayed.
Press [Quality Adjustment] on the [Adjustment Menu].
Press [Color Density Control].
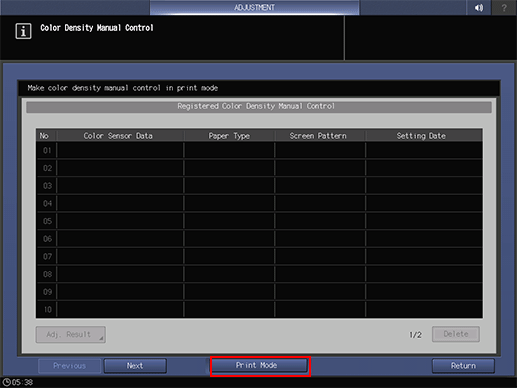
Press the [Color Density Manual Control] of [Expert Setting].
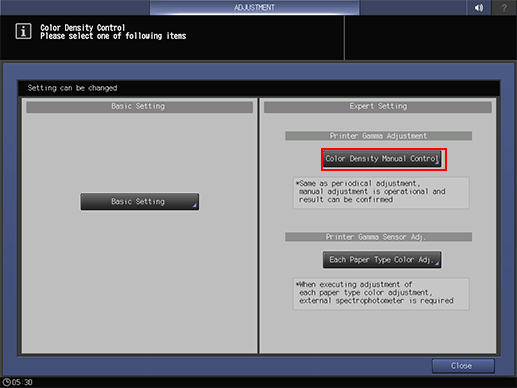
Press [Print Mode].
On the PRINT MODE screen, press [Quality Adj.].
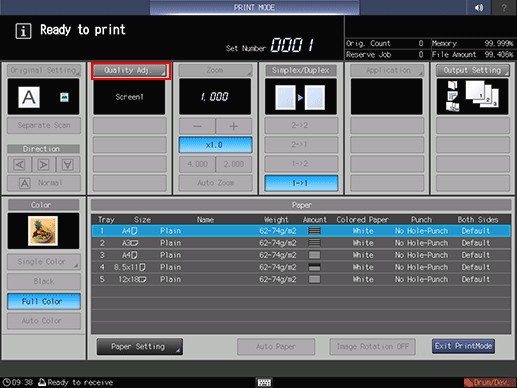
Press
of [Screen Pattern]. After the selection, press [Close].
After selecting the tray on the PRINT MODE screen, press Start on the control panel.
To set the output tray, press [Output Setting] at the upper right of the PRINT MODE screen.
When the chart is output, the manual control is completed.